
Road agencies collect enormous amounts of information about their networks—but collecting data is only the beginning.
The real value of road condition data emerges when it helps answer practical questions:
- Which roads need attention first?
- Where is pavement condition deteriorating fastest?
- Which locations should be investigated in greater detail?
- Where should maintenance budgets be allocated?
- Are recently treated roads performing as expected?
- How can agencies monitor thousands of kilometres without relying entirely on expensive specialist surveys?
These are fundamentally decision-making problems, not simply data-collection problems.
Modern road asset management is increasingly moving toward data-driven workflows that combine road condition measurements, visual inspections, geographic information, historical observations, and recurring surveys. When these datasets are analysed together, road agencies can move from isolated survey results to a more complete picture of network performance.
This is where road data analytics becomes particularly valuable.
RoadBounce supports this approach by providing smartphone-based road condition monitoring that can be deployed across large road networks. Rather than replacing engineering-grade profiling systems, it provides a scalable layer for network screening, recurring monitoring, maintenance prioritization, and infrastructure intelligence.
The result is a practical workflow:
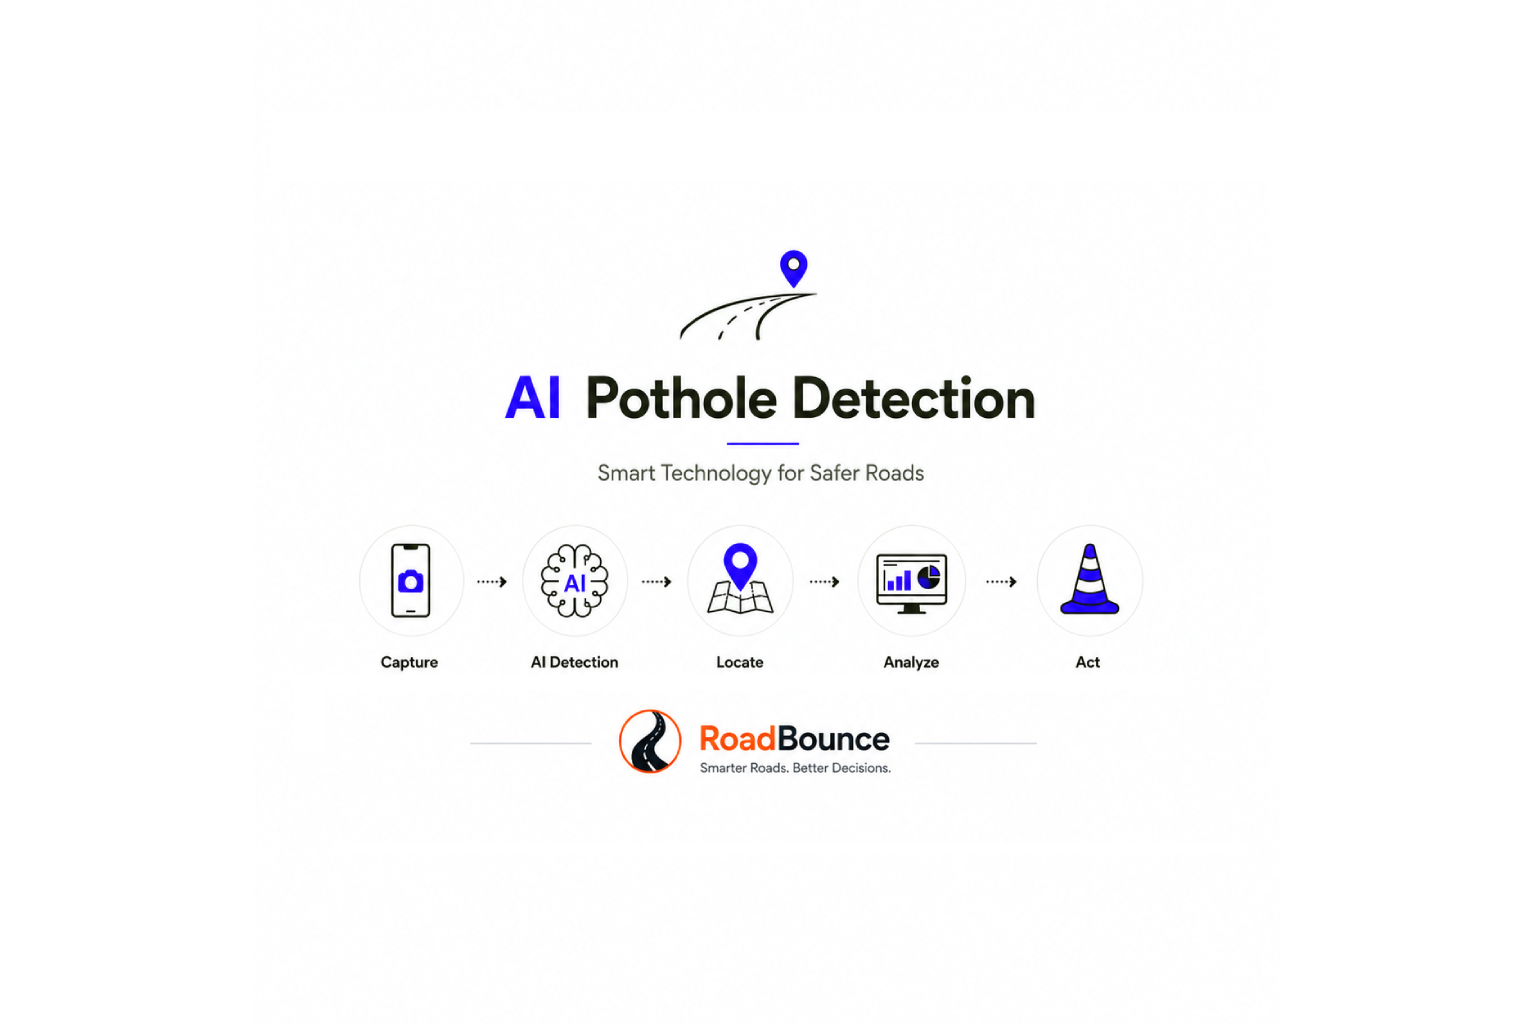
Collect → Analyse → Prioritize → Investigate → Act → Monitor
Why Road Data Needs to Become Actionable
A road condition dataset can contain thousands or millions of observations. But a spreadsheet full of measurements does not automatically tell an asset manager what to do next.
Consider a road network containing 5,000 kilometres of pavement.
A survey may identify:
- rough road sections,
- visible cracking,
- potholes,
- surface defects,
- changing ride quality,
- deterioration trends,
- geographic clusters of problems.
But the asset manager still needs to determine:
Where should limited resources be deployed first?
This is where analytics transforms raw observations into actionable intelligence.
Instead of viewing road condition as a collection of disconnected measurements, agencies can analyse the data according to:
- severity,
- location,
- deterioration rate,
- traffic importance,
- road hierarchy,
- maintenance history,
- risk,
- recurring condition trends,
- and available budgets.
The objective is not simply to identify bad roads.
It is to understand which roads matter most, why they matter, and what action should happen next.
1. Network-Wide Road Condition Screening
One of the most practical applications of road analytics is network-wide screening.
Traditional engineering surveys can provide highly detailed measurements, but deploying specialist survey vehicles across an entire network may not always be practical at high frequency.
Smartphone-based monitoring provides another layer of visibility.
RoadBounce can be used to collect road condition information across extensive networks using smartphones, helping agencies identify sections that warrant closer attention.
The resulting dataset can be analysed geographically to identify:
- sections with poor ride quality,
- clusters of pavement distress,
- potentially deteriorating corridors,
- roads requiring maintenance review,
- and locations requiring detailed engineering investigation.
This creates a screening layer before detailed investigation.
Instead of treating every kilometre of road equally, agencies can use network-level analytics to narrow their focus.
Network Screening vs. Engineering Validation
This distinction is important.
Network screening answers:
Where should we look more closely?
Engineering validation answers:
What exactly is happening here, and what engineering action is required?
RoadBounce is designed for the first role.
Traditional road profilers, laser-based systems, and other specialist engineering technologies remain valuable for detailed investigations, project development, and applications where high-resolution engineering measurements are required.
The two approaches can therefore work together rather than compete.
2. Maintenance Prioritization
One of the biggest challenges in pavement management is deciding which roads should receive attention first.
Budgets are finite, while maintenance requirements are not.
Road condition analytics can help agencies build a structured prioritization process.
For example, a network can be divided into condition categories such as:
| Condition | Potential Management Action |
|---|---|
| Good | Continue routine monitoring |
| Fair | Monitor and consider preventive treatment |
| Poor | Investigate maintenance requirements |
| Critical | Prioritize detailed engineering assessment |
The actual thresholds and treatment strategies should be defined according to the agency’s pavement management framework.
Road data can then be combined with other factors such as:
- traffic volume,
- road classification,
- strategic importance,
- safety considerations,
- maintenance history,
- and deterioration trends.
This allows agencies to move from:
“This road is rough.”
to:
“This road is deteriorating, carries significant traffic, and should be investigated before its condition worsens further.”
That difference is the foundation of data-driven maintenance planning.
3. Identifying Deterioration Trends
A single road survey provides a snapshot.
Recurring monitoring provides a trajectory.
This is one of the most valuable applications of road condition analytics.
Suppose a road records progressively poorer ride-quality measurements over several monitoring cycles.
Rather than waiting until visible deterioration becomes severe, an agency can identify the emerging trend and investigate the section earlier.
Analytics can compare observations over time to identify:
- improving sections,
- stable sections,
- gradually deteriorating sections,
- rapidly deteriorating sections,
- and locations where condition changes unexpectedly.
This supports a shift from purely reactive maintenance toward preventive maintenance planning.
The question becomes less about:
“Which roads are already failing?”
and more about:
“Which roads are showing signs that intervention may soon be necessary?”
That change can have significant implications for pavement lifecycle management.
4. Using IRI and Ride Quality as Network-Level Indicators
International Roughness Index (IRI) is an important measure for understanding longitudinal road profile and ride quality.
When collected consistently, IRI data can provide a useful indicator for comparing road sections and identifying locations where ride quality warrants further investigation.
For network monitoring, the value is not necessarily in examining every individual measurement.
It is in identifying patterns across the network.
Analytics can help answer questions such as:
- Which corridors have the highest roughness?
- Which road sections have changed since the previous survey?
- Where are roughness hotspots concentrated?
- Which areas should be investigated using detailed profiling?
- How is ride quality changing over time?
RoadBounce can contribute smartphone-based road condition measurements to this network-level analytical workflow.
Importantly, smartphone-derived measurements should be understood in the context of their intended use: large-scale screening and monitoring, not as a replacement for engineering-grade profiler surveys where detailed validation is required.
5. Combining Road Condition Data with AI Visual Inspections
Numbers alone do not tell the complete story.
A road may have poor ride quality, but an asset manager may also want to understand what visible pavement characteristics could be contributing to the problem.
This is where combining quantitative road measurements with AI-powered visual inspection can provide additional context.
Depending on the available dataset, visual analysis can help identify indicators such as:
- cracking,
- potholes,
- surface deterioration,
- patching,
- edge-related defects,
- and other visible pavement distress.
Combining these observations with location and ride-quality data creates a richer road condition picture.
For example:
High roughness + visible cracking + increasing deterioration trend
is potentially more informative than any single indicator by itself.
The analytical objective is not to automatically prescribe an engineering treatment.
Instead, it is to help identify where engineering attention is most valuable.
6. GIS-Based Road Network Intelligence
Road condition data becomes considerably more useful when it is connected to geography.
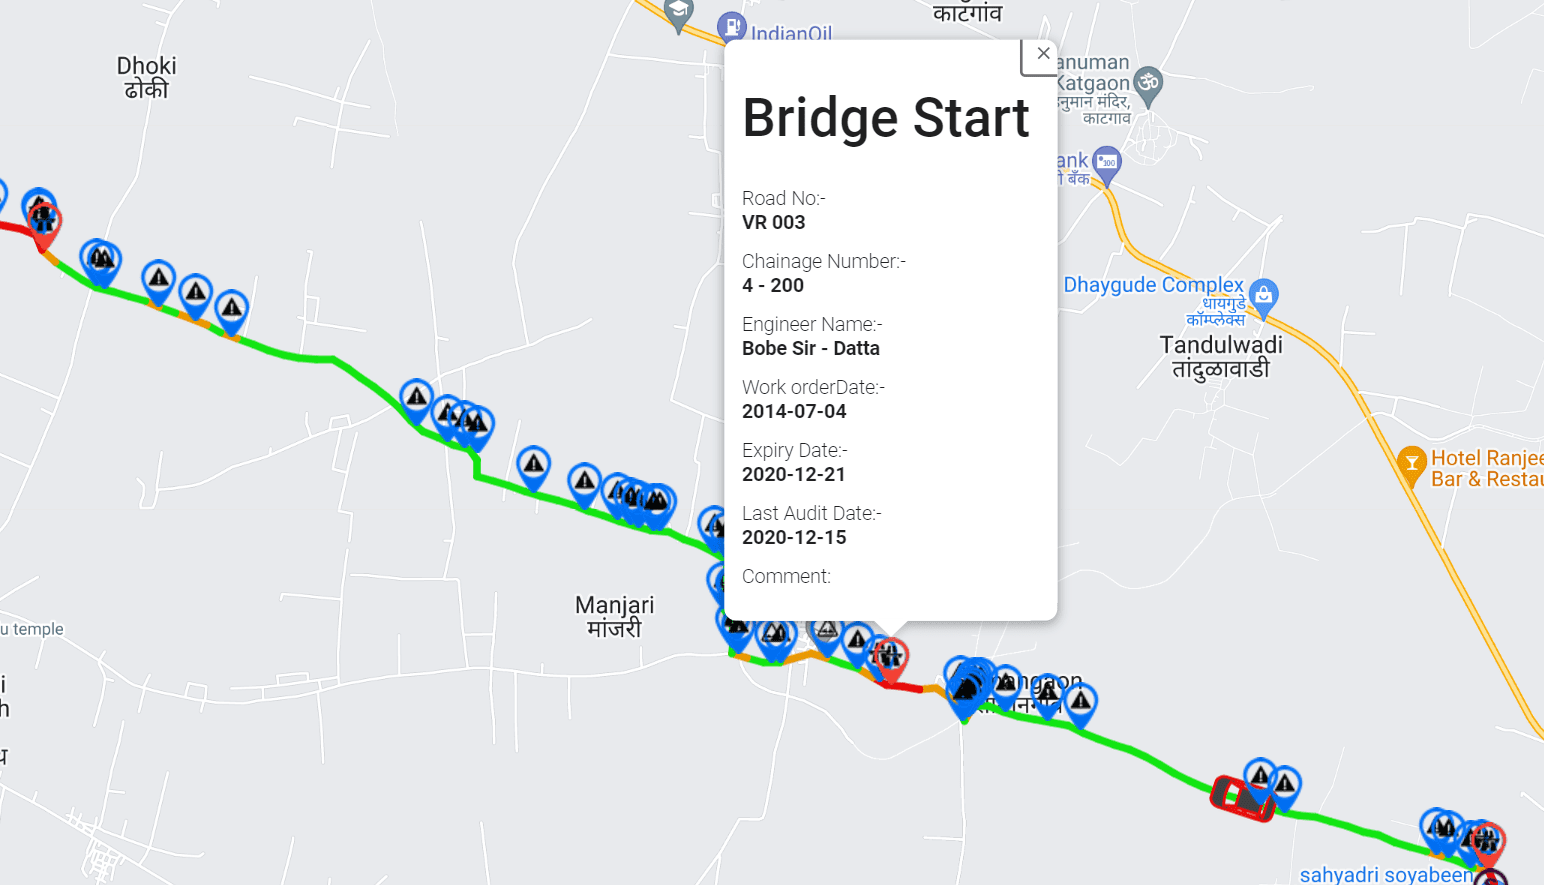
GIS integration allows road agencies to visualize condition information directly against their road network.
A GIS-based dashboard might show:
- road condition by corridor,
- roughness hotspots,
- pavement distress locations,
- maintenance history,
- recurring survey results,
- priority sections,
- and areas requiring further investigation.
This creates a geographic view of infrastructure performance.
Instead of asking:
“What does the dataset say?”
asset managers can ask:
“Where are the problems, how are they distributed, and what infrastructure do they affect?”
Spatial analytics can also reveal patterns that may not be obvious in conventional reports.
For example, several deteriorating road segments may form a continuous corridor, suggesting the need for a coordinated investigation rather than isolated maintenance interventions.
7. Optimizing Detailed Engineering Surveys
Specialist road profiling and engineering surveys remain essential for many applications.
The challenge is often where and when to deploy them.
A network screening platform can help make that deployment more targeted.
Imagine an agency responsible for thousands of kilometres of roads. Rather than sending a detailed survey vehicle across every section at the same frequency, network-level monitoring can first identify priority locations.
The workflow could look like this:
Step 1: Screen the network
Collect recurring road condition data using scalable smartphone-based surveys.
Step 2: Analyse the data
Identify roughness hotspots, distress indicators, deterioration trends, and other priority signals.
Step 3: Rank locations
Combine condition indicators with road importance and asset management criteria.
Step 4: Conduct detailed investigation
Deploy engineering-grade profiling or other specialist surveys to selected locations.
Step 5: Make engineering decisions
Use the detailed investigation to determine appropriate engineering interventions.
This approach does not eliminate specialist surveys.
It helps optimize where specialist surveys are deployed.
Traditional profilers remain valuable for detailed engineering investigations, while smartphone-based monitoring solutions provide cost-effective network-wide screening and continuous monitoring.
8. Measuring Maintenance Performance
Road analytics can also support post-maintenance monitoring.
After a pavement treatment or rehabilitation project, agencies need to understand whether the road continues to perform as expected.
Recurring monitoring can establish a comparable record of road condition before and after intervention.
For example:
Before treatment → Treatment completed → Follow-up survey → Subsequent monitoring
This creates an evidence base for understanding how road condition changes over time.
Analytics can help compare:
- pre-treatment condition,
- post-treatment condition,
- subsequent deterioration,
- and performance against other comparable sections.
This information can support future maintenance planning and help asset managers understand which intervention strategies appear to perform well under particular conditions.
9. Building a Road Condition History
Infrastructure management becomes more powerful when road agencies maintain a historical record rather than relying on individual survey campaigns.
A recurring road monitoring program can create a timeline for each road segment.
Over time, that history may include:
- survey dates,
- ride-quality measurements,
- visual distress observations,
- condition classifications,
- maintenance events,
- geographic information,
- and changes in condition.
This transforms road data into an infrastructure history.
Such historical data can support long-term asset management by helping agencies understand how individual sections and entire corridors evolve.
It also makes future decision-making less dependent on isolated survey reports.
10. Supporting Data-Driven Budget Allocation
Road condition analytics can also support budget discussions.
When agencies need to justify maintenance investment, condition data provides an evidence base for identifying network needs.
Instead of allocating budgets solely through historical patterns or anecdotal reports, decision-makers can examine:
- the distribution of road condition,
- the number of kilometres requiring attention,
- deterioration trends,
- priority corridors,
- recurring problem locations,
- and potential consequences of delaying intervention.
Analytics can then support scenario planning.
For example:
Scenario A: Focus spending on the worst-condition roads.
Scenario B: Increase preventive maintenance on roads approaching critical condition.
Scenario C: Prioritize strategically important corridors.
Each strategy can produce different network outcomes.
The important point is that road monitoring data provides the foundation for making those trade-offs more transparently.
11. Detecting Roads That Need a Closer Look
Perhaps the most practical use of network-scale analytics is simple:
Find the roads that deserve attention.
A large network contains too many kilometres for asset managers to inspect every section in detail at every point in time.
Analytics can create a shortlist.
For example, a priority score could consider:
Priority = Condition + Deterioration + Road Importance + Risk
The precise methodology will vary between agencies, but the principle is consistent.
Data is used to reduce a large network into a manageable set of locations requiring action.
This makes road monitoring more operational.
The platform is no longer simply collecting information.
It is helping answer the question:
What should we do next?
12. Creating a Continuous Road Monitoring Cycle
Perhaps the biggest advantage of scalable smartphone-based road monitoring is the ability to support more frequent assessments.
A conventional survey program may provide periodic snapshots of network condition.
A recurring monitoring strategy can create a much more dynamic view.
A typical cycle might be:
Survey → Analyse → Prioritize → Investigate → Maintain → Resurvey
Each cycle adds another layer of information.
Over time, this creates a feedback loop where road agencies can:
- identify deterioration,
- prioritize interventions,
- evaluate changes,
- monitor treated sections,
- and update priorities.
This is particularly valuable for large networks where condition can change significantly between major engineering surveys.
Turning Data into Infrastructure Intelligence
The ultimate objective of road analytics is not to create more dashboards.
It is to improve decisions.
A useful road monitoring platform should help answer five fundamental questions:
1. What is happening?
Measure road condition and identify visible deterioration.
2. Where is it happening?
Use GIS and spatial analysis to locate problem areas.
3. Is it getting worse?
Compare recurring observations and identify deterioration trends.
4. What deserves attention first?
Combine condition information with asset management priorities.
5. Where is detailed engineering investigation required?
Use network screening to direct specialist resources toward the locations where they can provide the greatest value.
This is where RoadBounce fits into a modern pavement management workflow.
RoadBounce: From Road Surveys to Actionable Intelligence
RoadBounce is designed to help road agencies, consultants, contractors, and infrastructure owners collect and interpret road condition information at network scale.
Its smartphone-based approach can support:
- Network-wide road condition monitoring
- IRI and ride-quality measurement
- AI-powered visual pavement inspection
- GIS-based road condition mapping
- Recurring road surveys
- Deterioration monitoring
- Maintenance prioritization
- Infrastructure asset management
- Identification of locations requiring detailed investigation
The key value is scalability.
Instead of viewing road monitoring as an occasional survey exercise, organizations can establish a more continuous information layer across their networks.
RoadBounce does not replace engineering-grade road profilers, acceptance testing, or detailed engineering validation.
Rather, it complements those technologies by helping organizations understand where detailed resources should be focused and by enabling broader, more frequent network monitoring between specialist surveys.
The Future of Road Management Is Data-Driven
Road infrastructure decisions are becoming increasingly dependent on timely, location-specific, and repeatable information.
The challenge is no longer simply collecting road data.
It is turning that data into decisions quickly enough to influence maintenance outcomes.
Network-scale smartphone monitoring, AI visual inspections, IRI analysis, GIS mapping, and recurring surveys can provide the foundation for a more intelligent road asset management strategy.
The most effective approach is not necessarily to choose between smartphone monitoring and engineering-grade profiling.
It is to use each technology where it delivers the greatest value.
RoadBounce can provide the network-wide screening and monitoring layer.
Traditional engineering profilers can provide detailed validation where it matters most.
Together, these capabilities can help road agencies move toward a more proactive model of infrastructure management—one where roads are monitored continuously, deterioration is identified earlier, maintenance priorities are supported by evidence, and specialist engineering resources are deployed where they are most needed.
Because the real value of road data is not the measurement itself.
It is the decision that the measurement enables.

Leave a Reply