
A pothole is rarely just a pothole.
For road agencies responsible for hundreds or thousands of kilometers of pavement, the more important question is not simply “Where are the potholes?” but “Which potholes require attention first?”
A small pothole on a low-volume service road may pose relatively little immediate risk. A similarly sized pothole located on a high-speed arterial, near a curve, intersection, school, or pedestrian crossing can create a substantially greater safety concern.
This makes pothole severity assessment an important part of modern pavement management.
Road agencies need a systematic way to identify potholes, assess their condition, understand their surrounding context, and rank them according to maintenance priority. The objective is to move from reactive pothole repair toward data-driven maintenance prioritization.
Smartphone-based road monitoring platforms such as RoadBounce can support this process by helping agencies collect road condition information across large networks, combine visual observations with ride-quality measurements, map defects geographically, and identify locations that deserve closer investigation.
The result is not a replacement for detailed engineering surveys. Instead, it provides a scalable layer of network-wide road intelligence that helps agencies decide where limited inspection and maintenance resources should be deployed.
What Is Pothole Severity Assessment?
Pothole severity assessment is the process of evaluating potholes according to characteristics that determine their potential impact, urgency, and maintenance priority.
A useful assessment can consider:
- Pothole size
- Pothole depth
- Location
- Traffic volume
- Vehicle speed
- Road classification
- Lane position
- Surrounding pavement condition
- Recurrence
- Drainage conditions
- Safety exposure
- Ride-quality impact
- Rate of deterioration
- Proximity to vulnerable road users
- Importance of the road to the network
The key principle is simple:
Pothole severity should be evaluated in context, not by physical dimensions alone.
A pothole’s dimensions tell only part of the story.
Why Pothole Ranking Matters for Road Agencies
Most road agencies operate under constraints.
Maintenance budgets are finite. Crews are limited. Specialized inspection resources are expensive. Meanwhile, pavement deterioration continues across the network.
If every pothole is treated with the same priority, agencies can struggle to direct resources toward the locations where intervention can provide the greatest benefit.
A structured pothole ranking system can help agencies:
1. Identify urgent defects
High-risk potholes can be flagged for rapid inspection or repair.
2. Prioritize maintenance crews
Instead of dispatching crews based solely on complaints, agencies can use condition and location data to build more informed work programs.
3. Detect deterioration patterns
Repeated observations can reveal corridors where potholes are becoming more frequent.
4. Support preventive maintenance
Clusters of potholes may indicate broader pavement or drainage problems that warrant investigation before deterioration accelerates.
5. Improve resource allocation
Maintenance budgets can be directed toward roads and defects with higher operational or safety significance.
6. Build a historical record
Recurring road surveys create a condition history that can help agencies understand how defects evolve over time.
Pothole Severity Should Not Be Based on Size Alone
A common approach is to classify potholes based on dimensions such as diameter and depth.
Those measurements are useful, but they are not enough to determine maintenance priority.
Consider two hypothetical potholes:
Pothole A
- 50 mm deep
- Located on a low-volume residential street
- Low vehicle speeds
- Away from intersections
- No significant surrounding deterioration
Pothole B
- 50 mm deep
- Located on a high-speed arterial
- Positioned in a wheel path
- High traffic volume
- Located near an intersection
- Surrounding pavement shows additional distress
Although both potholes have the same nominal depth, their operational significance can be very different.
This is why modern pothole assessment should combine defect characteristics with network context.
Key Factors for Ranking Pothole Severity
There is no single universal scoring formula that works perfectly for every road network. Agencies should develop a methodology aligned with their road classifications, maintenance policies, traffic conditions, and available data.
However, several factors provide a strong foundation.
1. Pothole Depth
Depth is one of the most intuitive indicators of pothole severity.
A deeper pothole can:
- Produce greater vehicle impact
- Affect ride quality
- Increase the likelihood of vehicle damage
- Become more difficult to avoid
- Indicate more advanced pavement deterioration
Agencies can establish depth bands appropriate to their maintenance standards.
However, depth should be interpreted alongside other factors rather than used as the sole ranking criterion.
2. Pothole Size
The surface dimensions of a pothole can also influence severity.
A larger pothole can affect a greater portion of the travel lane and may be more difficult for drivers to avoid.
Useful measurements may include:
- Length
- Width
- Estimated area
- Approximate diameter
- Lane coverage
Where automated or smartphone-based visual assessment is used, these observations can become part of a broader road-condition dataset.
3. Lane Position
Where the pothole occurs can matter as much as how large it is.
A pothole positioned directly in a vehicle wheel path may have greater operational significance than one located near the road edge.
Potentially important location categories include:
- Wheel path
- Center of lane
- Lane edge
- Shoulder
- Intersection approach
- Turning area
- Bus stop area
- Bicycle lane
Location data therefore adds important context to physical severity.
4. Traffic Volume
Traffic exposure is another important ranking factor.
A pothole on a road carrying thousands of vehicles each day affects many more road users than an equivalent pothole on a lightly trafficked road.
Agencies can incorporate:
- Average daily traffic
- Heavy vehicle percentage
- Peak traffic periods
- Commercial vehicle activity
- Public transport usage
This allows maintenance prioritization to reflect exposure as well as defect condition.
5. Vehicle Speed
Road speed can influence the potential consequences of encountering a pothole.
A defect on a high-speed road may deserve a higher priority than an equivalent defect on a low-speed street.
Speed context can therefore help agencies distinguish between potholes with similar physical characteristics but different operational risks.
6. Road Classification
Not every road serves the same function.
An agency may classify roads into categories such as:
- National or primary highways
- Arterial roads
- Collector roads
- Local streets
- Industrial roads
- Residential roads
- Service roads
The classification can be incorporated into a pothole priority score.
For example, a pothole on a strategically important arterial may receive a higher network priority than an equivalent defect on a low-volume local road.
7. Proximity to High-Risk Locations
Context becomes particularly important around sensitive locations.
Potholes near:
- Schools
- Hospitals
- Intersections
- Pedestrian crossings
- Bus stops
- Railway crossings
- Sharp curves
- Bridges
- Toll facilities
- Major junctions
may deserve additional attention depending on agency policy and local conditions.
The objective is not necessarily to declare every pothole in these locations an emergency, but to ensure that location context is considered systematically.
8. Surrounding Pavement Condition
A pothole may be an isolated defect—or a symptom of broader pavement deterioration.
If a pothole occurs alongside:
- Alligator cracking
- Rutting
- Raveling
- Edge deterioration
- Patching
- Depressions
- Drainage-related distress
it may indicate a more fundamental pavement problem.
This distinction is valuable for maintenance planning.
A crew might repair an isolated pothole with localized treatment, while a deteriorated pavement section may require a broader engineering investigation or rehabilitation strategy.
9. Recurrence and Deterioration Rate
One of the most valuable capabilities of recurring road monitoring is the ability to understand how conditions change over time.
Suppose a pothole is repaired three times within six months.
That history is more informative than a single inspection record.
Repeated observations can help agencies identify:
- Recurring pothole locations
- Rapidly deteriorating sections
- Seasonal deterioration
- Drainage-related patterns
- Repeated repair locations
- Corridors requiring deeper investigation
This shifts pothole management from a static inventory toward longitudinal pavement intelligence.
A Practical Pothole Severity Scoring Framework
Road agencies can develop a multi-factor priority score instead of relying on one measurement.
A simplified conceptual framework might look like this:
| Factor | Example Consideration |
|---|---|
| Depth | Shallow, moderate, deep |
| Size | Small, medium, large |
| Traffic | Low, medium, high |
| Speed | Low, moderate, high |
| Lane position | Edge, lane, wheel path |
| Road class | Local, collector, arterial |
| Context | Normal, sensitive location |
| Surrounding distress | Limited, moderate, extensive |
| Recurrence | Isolated, recurring |
| Ride impact | Low, moderate, high |
Each factor can be assigned a weighting according to the agency’s objectives.
For example:
Pothole Priority Score = Condition Severity + Traffic Exposure + Road Importance + Location Risk + Deterioration Trend
The exact formula should be customized rather than treated as a universal engineering standard.
From Severity to Maintenance Priority
Severity and priority are related—but they are not identical.
A pothole can be physically severe without being the highest-priority maintenance location across the entire network.
A better framework separates:
Condition Severity
How bad is the defect?
from:
Maintenance Priority
How urgently should the agency respond?
This distinction allows agencies to incorporate network context.
For example:
High severity + low exposure
may result in a moderate maintenance priority.
Meanwhile:
Moderate severity + high traffic + high-speed road + sensitive location
could receive a higher operational priority.
This approach produces a more useful maintenance program.
How RoadBounce Can Support Pothole Prioritization
RoadBounce is designed for network-scale road condition monitoring and infrastructure intelligence.
Rather than requiring agencies to rely exclusively on occasional manual inspections, smartphone-based monitoring can help create a broader picture of road conditions across the network.
RoadBounce can support workflows involving:
- Smartphone-based road surveys
- Road condition monitoring
- AI-assisted visual inspection
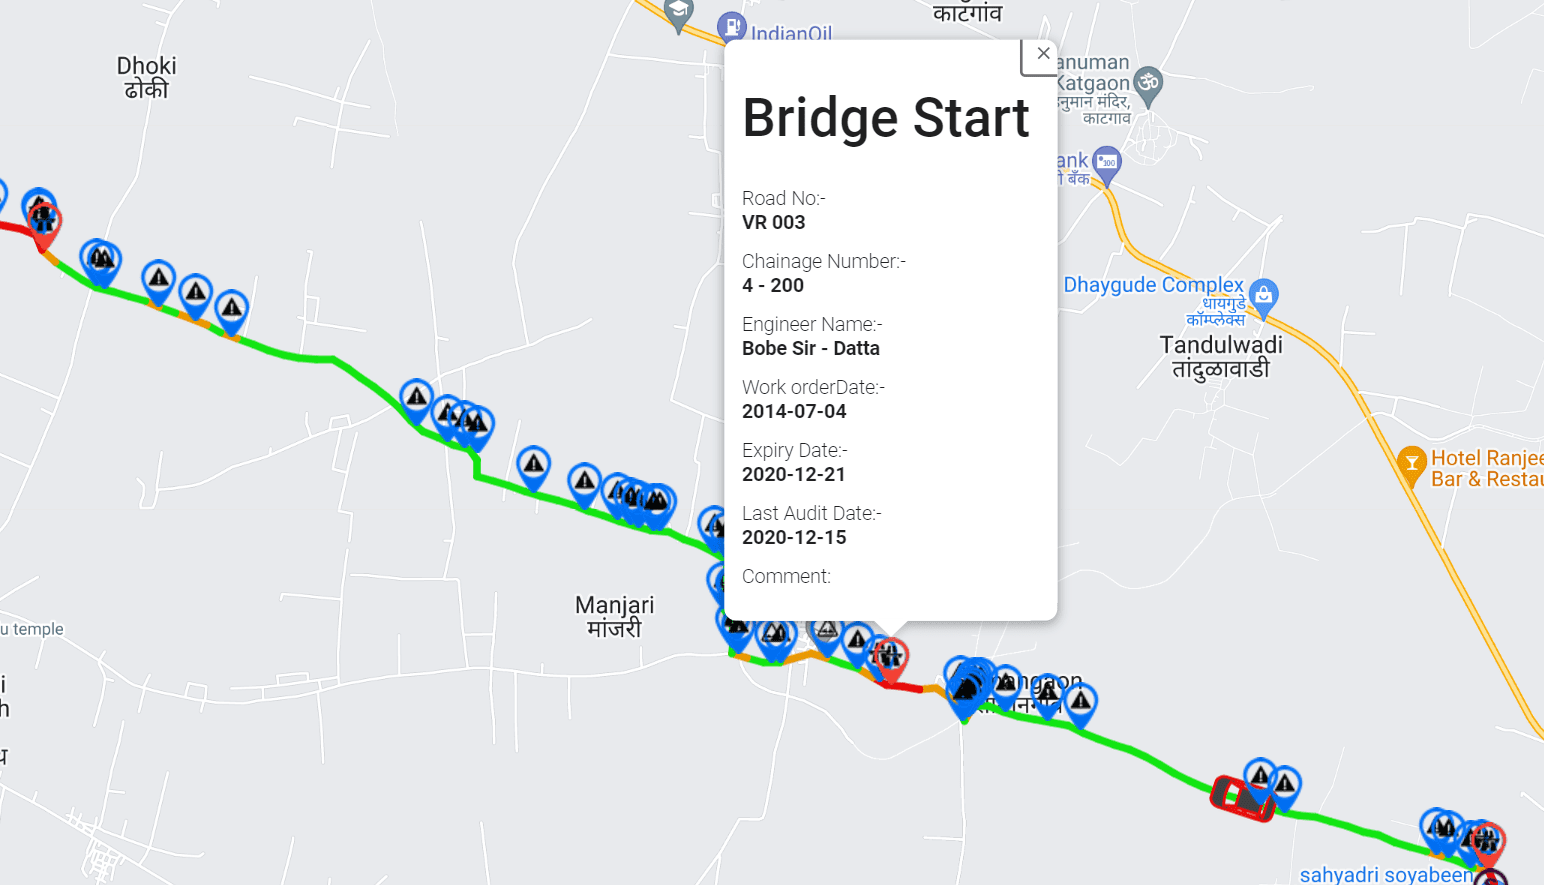
- GIS-based mapping
- Ride-quality measurements
- Recurring assessments
- Defect location tracking
- Network-level condition analysis
This combination can help agencies move from isolated pothole reports toward a more comprehensive understanding of where pavement problems are occurring.
Combining Pothole Detection With Ride Quality
A pothole is a visible defect, but road users experience pavement condition through the vehicle as well.
That makes ride-quality information useful as a complementary data layer.
Smartphone-based sensing can help capture changes in vehicle response associated with road roughness and surface irregularities.
When combined with visual inspection data, agencies can gain two perspectives:
Visual condition
What does the pavement look like?
Ride quality
How does the road surface affect vehicle movement?
This combination can make network-level screening more informative than relying on visual pothole counts alone.
Importantly, these measurements should be used appropriately for network screening and monitoring, rather than presented as a substitute for engineering-grade profiler measurements.
Using GIS to Understand Pothole Clusters
Location is fundamental to infrastructure management.
When potholes are mapped geographically, agencies can begin identifying spatial patterns.
For example, GIS analysis may reveal clusters of potholes:
- Along a particular corridor
- Near drainage structures
- Around intersections
- In a particular neighborhood
- Along heavily trafficked routes
- Within a specific maintenance jurisdiction
A cluster can be more significant than an individual pothole.
It may indicate that the agency should investigate the underlying pavement section rather than repeatedly treating individual defects.
Recurring Monitoring Is More Valuable Than One-Time Inspection
Road networks change continuously.
Weather, traffic loading, drainage, construction activity, utility work, and pavement aging can all influence road condition.
A single pothole survey provides a snapshot.
Recurring monitoring provides a time series.
With repeated assessments, agencies can compare:
Survey 1 → Survey 2 → Survey 3 → Survey 4
and identify whether a location is:
- Stable
- Improving
- Deteriorating
- Repeatedly repaired
- Developing new defects
This can support a more proactive pavement management strategy.
Pothole Prioritization Can Support Preventive Maintenance
The ultimate objective should not be to create a perfect pothole database.
The objective is to make better maintenance decisions.
If an agency identifies a corridor where potholes repeatedly emerge, simply repairing each pothole individually may not address the underlying problem.
Recurring defects can trigger further investigation into:
- Drainage
- Pavement structure
- Surface condition
- Base failures
- Utility cuts
- Water infiltration
- Traffic loading
- Previous repair performance
This creates a pathway from defect detection → prioritization → investigation → appropriate treatment.
Where Traditional Profilers Fit
Network-scale smartphone monitoring and traditional road profiling should not be treated as competing technologies.
They serve different purposes.
RoadBounce can support network screening and recurring monitoring, helping agencies understand conditions across large road networks and identify locations that warrant additional attention.
Traditional profilers remain valuable for detailed engineering investigations, including situations where high-precision pavement measurements are required for engineering validation or specialized assessment.
A practical workflow can therefore be:
Step 1: Screen the Network
Use scalable road monitoring to assess broad network conditions.
Step 2: Identify Priority Locations
Combine pothole observations, ride-quality indicators, GIS information, road hierarchy, and historical trends.
Step 3: Investigate Priority Sections
Deploy specialized inspection resources where more detailed engineering information is needed.
Step 4: Plan the Appropriate Intervention
Select localized repair, preventive treatment, rehabilitation, or further investigation based on engineering findings.
Step 5: Monitor Again
Use recurring network monitoring to evaluate how conditions evolve after intervention.
This approach helps agencies use specialized resources where they provide the greatest value.
Building a Pothole Priority Matrix
A practical agency workflow can categorize potholes into priority groups.
Priority 1 — Immediate Attention
Potentially includes defects with combinations of:
- Significant physical severity
- High traffic exposure
- High vehicle speeds
- Critical road locations
- Significant ride impact
- Rapid deterioration
Priority 2 — Planned Repair
May include:
- Moderate-to-high severity
- Moderate traffic exposure
- Recurring defects
- Deteriorating pavement conditions
Priority 3 — Routine Maintenance
May include:
- Smaller defects
- Low traffic exposure
- Limited surrounding deterioration
- Low immediate operational significance
Priority 4 — Monitor
Potentially includes:
- Minor defects
- Stable locations
- Low exposure
- Locations scheduled for recurring assessment
The exact thresholds should be established by the responsible road agency.
The Role of AI in Pothole Monitoring
AI-assisted visual inspection can help agencies process large quantities of road imagery and identify potential pavement defects at scale.
Instead of manually reviewing every kilometer with equal intensity, agencies can use automated analysis to help identify candidate locations for further review.
Potential applications include:
- Pothole detection
- Crack identification
- Surface distress classification
- Defect localization
- Change detection
- Condition trend analysis
AI should be treated as a screening and decision-support capability, with appropriate validation and human or engineering review where required.
Turning Pothole Data Into Road Network Intelligence
The real value of pothole monitoring emerges when individual defects become part of a broader infrastructure dataset.
Imagine an agency has:
Pothole locations + severity indicators + road hierarchy + traffic information + ride quality + visual distress + GIS + historical observations
That dataset can answer much more useful questions:
- Which corridors are deteriorating fastest?
- Where are potholes recurring?
- Which road classes have the highest defect concentration?
- Which areas require detailed engineering investigation?
- Where should maintenance crews be deployed first?
- Which sections should receive preventive treatment?
- Are repairs reducing recurring defects?
- Where should specialized surveys be concentrated?
This is the transition from pothole reporting to infrastructure intelligence.
A Better Strategy for Managing Potholes
Effective pothole management is not simply about repairing defects faster.
It is about creating a system that helps agencies:
Detect → Assess → Rank → Investigate → Repair → Monitor
Each stage contributes to better decision-making.
A scalable monitoring platform can help strengthen the early stages of this process, while engineering surveys and field investigations remain important for locations requiring detailed assessment.
The combination creates a more efficient pavement management workflow.
Final Thoughts
Pothole severity assessment should go beyond asking how big or deep a defect is.
A more effective approach considers physical severity, traffic exposure, road importance, location, surrounding pavement condition, ride quality, recurrence, and deterioration trends.
For road agencies managing extensive networks, the challenge is not merely finding potholes. It is determining which problems matter most and where limited maintenance resources should be focused.
RoadBounce supports this network-level challenge by providing a scalable smartphone-based approach to road condition monitoring, AI-assisted visual inspection, GIS mapping, ride-quality measurement, and recurring assessment.
It is not a replacement for engineering-grade road profilers or detailed validation surveys. Instead, it can serve as an additional layer of network-wide intelligence, helping agencies screen larger networks more frequently and identify where specialized engineering resources should be deployed.
The smarter pothole strategy is therefore not simply “repair every pothole as soon as possible.”
It is:
Monitor the network continuously, understand which defects matter most, prioritize intelligently, investigate where necessary, and intervene before deterioration becomes more expensive.
That is how pothole management can become part of a modern, data-driven pavement management strategy.


Leave a Reply