
Managing a modern road network requires more than periodic visual inspections and isolated engineering surveys. Roads are constantly exposed to traffic loading, weather, drainage problems, construction activity, utility work, and natural deterioration. Without timely and structured data, road agencies and infrastructure owners can struggle to understand where conditions are changing, which sections require attention, and how to prioritize limited maintenance budgets.
This is where road data analytics becomes increasingly important.
Road data analytics combines road condition measurements, pavement distress information, geographic data, historical observations, traffic information, and other infrastructure datasets to help organizations understand the current and changing condition of their road networks.
For large networks, smartphone-based technologies such as RoadBounce can make recurring road condition monitoring more scalable. By collecting ride-quality information and combining it with AI-powered visual inspections and GIS-based mapping, RoadBounce helps transform individual road surveys into actionable network intelligence.
The objective is not to replace specialized engineering equipment. Instead, the goal is to make network-wide screening and continuous monitoring more practical, while helping identify locations where detailed engineering investigations may be warranted.
What Is Road Data Analytics?
Road data analytics is the process of collecting, integrating, analyzing, and interpreting data related to road infrastructure to support better maintenance, planning, and asset management decisions.
A road network can generate large amounts of information, including:
- International Roughness Index (IRI)
- Ride-quality measurements
- Pavement distress observations
- Cracking
- Potholes
- Rutting indicators
- Surface deterioration
- Road geometry
- GPS coordinates
- GIS layers
- Traffic information
- Historical condition records
- Maintenance and rehabilitation history
- Inspection imagery
- Construction information
- Environmental and weather data
When these datasets are analyzed together, agencies can move beyond asking “What is the condition of this road?” and begin answering more strategic questions:
- Which roads are deteriorating fastest?
- Where are the most significant problems concentrated?
- Which sections should be inspected in greater detail?
- Which maintenance activities should receive priority?
- Where could preventive maintenance extend pavement life?
- How has road condition changed over time?
- Where should limited engineering resources be deployed?
That shift—from collecting data to generating actionable intelligence—is the central value of road data analytics.
Why Road Data Analytics Matters
Road infrastructure represents a significant long-term investment. Maintaining it effectively requires organizations to balance condition, risk, traffic demand, available funding, and expected pavement life.
Traditional inspection programs can provide valuable information, but large road networks create a fundamental challenge: coverage and frequency.
A network may contain thousands of lane-kilometers spread across cities, regions, or entire countries. Inspecting every section frequently using specialized vehicles can be difficult and expensive.
Road data analytics helps address this challenge by enabling a more structured approach:
Collect → Map → Analyze → Prioritize → Investigate → Maintain → Monitor
Instead of treating each survey as an isolated exercise, agencies can build a continuous picture of network condition.
The Shift From Periodic Inspection to Continuous Monitoring
Historically, road condition assessments have often been performed at defined intervals. While periodic surveys remain important, deterioration does not follow an administrative calendar.
A pavement can change significantly between inspection cycles.
Recurring smartphone-based monitoring allows organizations to collect observations more frequently across a broader network. This can help identify emerging issues before they become major maintenance problems.
The result is a shift from:
Periodic inspection → Continuous network intelligence
This does not mean that every measurement must be collected every day. Rather, it means infrastructure managers can establish repeatable monitoring programs that provide more frequent visibility into changing road conditions.
Key Components of Road Data Analytics
Effective road data analytics typically combines several different categories of information.
1. Road Roughness and Ride Quality
Road roughness is an important indicator of how smoothly vehicles travel over a pavement surface.
The International Roughness Index (IRI) is one of the most widely recognized measures used to characterize longitudinal road roughness.
IRI data can help agencies:
- Identify sections with poor ride quality
- Compare road segments
- Track deterioration
- Support maintenance prioritization
- Identify locations requiring further investigation
Smartphone-based monitoring platforms can support large-scale ride-quality screening by using sensors available within smartphones.
RoadBounce uses smartphone-based measurements to help organizations understand ride quality across larger networks without requiring every road section to be surveyed using specialized profiling equipment.
The resulting information can be used as part of a broader pavement management workflow.
2. Pavement Distress Data
Ride quality alone does not explain every pavement problem.
Two road sections may have similar roughness values but require very different maintenance strategies because their surface distress patterns differ.
Visual pavement information can identify conditions such as:
- Cracks
- Potholes
- Surface defects
- Patch deterioration
- Other visible pavement anomalies
AI-powered visual inspection can help process road imagery at scale and convert visual observations into structured pavement information.
Combining ride-quality measurements with visual distress information creates a more complete picture of road condition.
3. GIS and Location Intelligence
Road condition data becomes significantly more useful when it is geographically referenced.
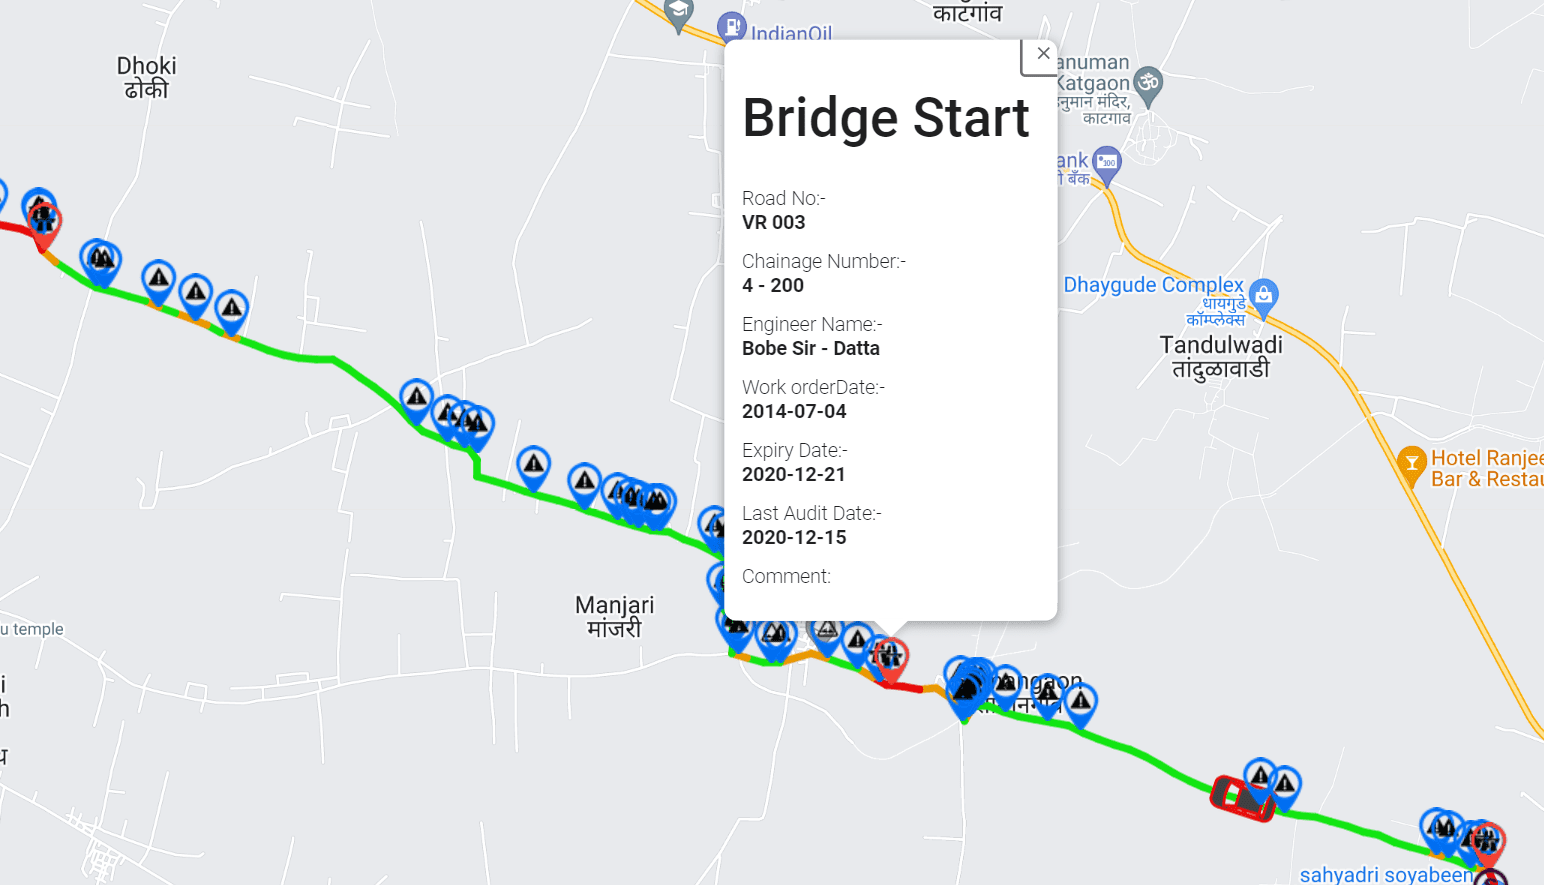
GIS integration allows road agencies to visualize condition information on maps and examine relationships between:
- Pavement condition
- Road hierarchy
- Traffic routes
- Maintenance history
- Geographic areas
- Infrastructure assets
- Drainage systems
- Administrative boundaries
Instead of looking at a spreadsheet containing thousands of measurements, decision-makers can visualize where problems occur.
This makes GIS an important foundation for modern infrastructure intelligence.
4. Historical Road Condition Data
A single road survey provides a snapshot.
A sequence of surveys creates a trend.
Historical data can reveal whether a road is:
- Improving
- Stable
- Slowly deteriorating
- Rapidly deteriorating
- Repeatedly experiencing distress
Tracking condition over time is particularly valuable for preventive maintenance planning.
If a road section repeatedly shows worsening indicators, it may deserve attention before its condition reaches a critical level.
Road Data Analytics and Pavement Management
Road data analytics is closely connected to pavement management systems (PMS).
A pavement management system helps organizations make decisions about maintaining and rehabilitating road infrastructure over its lifecycle.
Analytics can support key PMS activities such as:
Network Inventory
Understanding what roads exist, where they are located, and what assets are associated with them.
Condition Assessment
Determining the current condition of road sections using available measurements and observations.
Deterioration Analysis
Understanding how pavement condition changes over time.
Maintenance Prioritization
Ranking road sections according to condition, risk, importance, and available resources.
Treatment Planning
Identifying appropriate locations for preventive maintenance, rehabilitation, or further engineering investigation.
Budget Optimization
Helping decision-makers understand how different investment strategies may affect network condition.
The more frequently and consistently condition information is updated, the more useful these systems can become.
How RoadBounce Supports Road Data Analytics
RoadBounce is designed around a simple challenge faced by road agencies and infrastructure owners:
How can large road networks be monitored frequently enough to support better decisions?
RoadBounce uses smartphone-based road survey technology to collect road condition information at scale.
Its capabilities can support a workflow that combines:
- Smartphone-based road measurements
- Ride-quality monitoring
- IRI measurements
- AI-powered visual inspections
- GPS-based location information
- GIS mapping
- Recurring road surveys
- Network-level analytics
This creates an infrastructure intelligence layer that helps organizations understand road conditions across larger geographic areas.
The emphasis is on network screening and recurring monitoring, not replacing specialized engineering surveys.
Network Screening vs. Engineering Validation
One of the most important distinctions in modern road data collection is the difference between network screening and engineering validation.
Network Screening
Network screening focuses on understanding the condition of a large road network and identifying priority locations.
RoadBounce is designed for this role.
It can help organizations:
- Survey larger networks
- Monitor roads repeatedly
- Identify potentially problematic sections
- Compare road conditions
- Map pavement issues
- Prioritize maintenance resources
- Determine where detailed investigation may be justified
The objective is breadth, scalability, and recurring visibility.
Engineering Validation
Traditional road profilers and specialized engineering survey equipment remain important when detailed engineering measurements and validation are required.
These systems are appropriate for applications where specialized measurements, engineering validation, or project-specific testing requirements apply.
The objective is detailed engineering characterization and validation.
A Complementary Workflow
A practical infrastructure management workflow can therefore look like this:
Stage 1 — Network Screening
Use scalable smartphone-based monitoring to assess broad areas of the network.
↓
Stage 2 — Identify Priority Locations
Use condition analytics, ride-quality information, visual distress data, and GIS to identify sections requiring attention.
↓
Stage 3 — Engineering Investigation
Deploy specialized engineering equipment and traditional profilers where detailed investigation or validation is required.
↓
Stage 4 — Maintenance Decision
Use the combined information to determine the appropriate maintenance or rehabilitation strategy.
↓
Stage 5 — Recurring Monitoring
Continue monitoring the network to understand how conditions change.
This approach allows agencies to use specialized equipment where it adds the most value while maintaining broad visibility across the overall road network.
Benefits of Data-Driven Road Monitoring
1. Network-Wide Visibility
Large road networks can be difficult to monitor comprehensively.
Smartphone-based surveys can make recurring data collection more scalable, helping organizations build broader visibility into network condition.
2. More Frequent Assessments
Because smartphone-based data collection can be incorporated into routine road journeys, organizations can potentially increase the frequency of network monitoring.
More frequent observations can improve awareness of emerging deterioration.
3. Earlier Detection of Deterioration
Road problems often become more expensive to address as deterioration progresses.
Regular monitoring can help identify changes earlier, supporting preventive maintenance strategies.
4. Better Maintenance Prioritization
Not every road requires immediate intervention.
Analytics can help agencies identify sections that deserve higher priority based on condition indicators and other decision criteria.
5. Better Allocation of Engineering Resources
Specialized survey vehicles and engineering teams can be directed toward locations that have already been identified through network-level screening.
This can make detailed investigations more targeted.
6. Improved Historical Analysis
Recurring surveys create a valuable time series.
Over time, this can help organizations understand deterioration patterns and evaluate the effects of maintenance activities.
7. Stronger Infrastructure Intelligence
Combining road condition, imagery, location, and historical data provides a broader foundation for infrastructure management.
AI in Road Data Analytics
Artificial intelligence is increasingly being used to process large volumes of road imagery and identify visible pavement conditions.
Traditional manual inspection can be time-consuming, particularly when large networks are involved.
AI-assisted inspection can help automate portions of the workflow by identifying potential pavement distress from road imagery.
Typical applications may include identifying:
- Potholes
- Cracks
- Surface defects
- Road anomalies
- Other visible pavement conditions
However, AI outputs should be treated appropriately within the engineering workflow.
AI-based detection is highly useful for screening, classification, mapping, and prioritization, while engineering decisions may require additional investigation and professional validation.
This distinction is important because road data analytics is ultimately about supporting better decisions—not simply producing more data.
GIS-Based Road Data Analytics
GIS transforms road condition data into spatial intelligence.
A road agency can use GIS to visualize condition information by:
- Road segment
- District
- Route
- Road class
- Geographic area
- Maintenance zone
- Priority category
For example, a dashboard could show road segments categorized according to condition.
Managers could then investigate clusters of deteriorating roads and compare them with:
- Traffic volumes
- Previous maintenance
- Construction projects
- Drainage conditions
- Geographic characteristics
This makes it easier to move from data collection to decision-making.
Road Data Analytics for Preventive Maintenance
Preventive maintenance is fundamentally about intervening before deterioration becomes significantly more severe.
Analytics can support preventive maintenance by identifying road sections showing early signs of decline.
Consider two hypothetical road sections.
Road A
- Good ride quality
- Limited visible distress
- Stable historical condition
Road B
- Increasing roughness
- Growing surface distress
- Negative deterioration trend
Even if both roads remain technically serviceable, Road B may warrant closer attention.
This is where recurring monitoring becomes valuable.
Rather than waiting until a road reaches a visibly poor condition, agencies can use trend information to support earlier intervention.
Road Data Analytics for Maintenance Prioritization
Infrastructure budgets are limited, while maintenance requirements are extensive.
A data-driven prioritization framework can help agencies rank road sections using multiple factors.
For example:
Priority Score = Condition + Deterioration Trend + Road Importance + Risk + Traffic + Maintenance Strategy
The exact methodology will vary by organization.
A road agency might assign greater weight to:
- High-traffic routes
- Strategic corridors
- Roads serving critical facilities
- Rapidly deteriorating sections
- Roads with recurring distress
- Routes where preventive maintenance could preserve pavement condition
This approach creates a more transparent basis for allocating resources.
What Data Should a Road Agency Collect?
A modern road data program should be designed around decisions rather than simply maximizing the amount of data collected.
Useful categories include:
| Data Category | Example Use |
|---|---|
| IRI / roughness | Ride-quality screening |
| Visual distress | Identify pavement defects |
| GPS | Locate road conditions |
| GIS | Spatial analysis |
| Historical surveys | Track deterioration |
| Traffic data | Understand road importance |
| Maintenance history | Evaluate treatment performance |
| Road inventory | Manage infrastructure assets |
| Imagery | Visual documentation |
| Engineering surveys | Detailed validation |
The most effective programs combine multiple data sources rather than relying on one metric.
How to Build a Road Data Analytics Program
Organizations implementing a road analytics program can follow a structured process.
Step 1: Define the Decisions
Start by asking what decisions the data needs to support.
Examples include:
- Which roads need inspection?
- Where should preventive maintenance occur?
- Which sections require engineering investigation?
- How is the network deteriorating?
- Where should survey resources be deployed?
Step 2: Establish a Network Inventory
Create a consistent digital representation of the road network.
Segment roads into manageable units and establish location references.
Step 3: Collect Baseline Data
Perform an initial network-wide screening survey.
This creates a baseline against which future observations can be compared.
Step 4: Integrate Condition Indicators
Combine:
- Ride quality
- IRI
- Visual distress
- GPS
- GIS
- Historical data
Step 5: Establish Priority Categories
Classify road sections according to condition and management requirements.
Step 6: Conduct Detailed Investigations
Where screening identifies priority sections, deploy appropriate engineering survey methods.
Traditional profilers remain valuable at this stage for detailed engineering investigation and validation.
Step 7: Establish Recurring Monitoring
Repeat network surveys at suitable intervals.
The objective is to create a continuous understanding of network condition rather than relying solely on isolated assessments.
Challenges in Road Data Analytics
Road analytics offers significant advantages, but implementation also requires careful planning.
Data Quality
Inconsistent collection methods can make historical comparisons difficult.
Organizations should establish consistent survey protocols and quality-control processes.
Data Integration
Road condition data often comes from multiple systems.
Integrating GIS, pavement management, maintenance, imagery, and engineering datasets can require thoughtful data architecture.
Data Volume
Large networks can generate significant quantities of imagery and sensor information.
Cloud-based processing and structured data management can help organizations handle growing datasets.
Interpretation
Data does not automatically produce good decisions.
Condition indicators need to be interpreted within the context of road function, traffic, climate, construction history, and maintenance strategy.
Engineering Validation
Network screening should not be confused with detailed engineering investigation.
When project-level decisions require specialized measurements or validation, appropriate engineering survey methods remain essential.
The Future of Road Infrastructure Intelligence
The future of pavement management is moving toward more connected, data-driven infrastructure systems.
Instead of relying on occasional surveys and static reports, road agencies can increasingly build living datasets that are updated through recurring monitoring.
Several trends are driving this transformation:
Connected Smartphones
Smartphones provide an increasingly accessible sensing platform for scalable road monitoring.
Artificial Intelligence
AI can help process large quantities of road imagery and identify potential pavement distress.
GIS Integration
Spatial analytics makes it easier to connect road conditions with surrounding infrastructure and geographic information.
Cloud Analytics
Cloud platforms can support centralized processing, visualization, and collaboration.
Predictive Maintenance
Historical condition trends can support better deterioration analysis and maintenance planning.
Continuous Monitoring
Recurring surveys can provide more frequent visibility into changing road conditions.
Together, these technologies are creating a transition from reactive road maintenance toward proactive infrastructure management.
Road Data Analytics: From Data Collection to Better Decisions
The true value of road data analytics is not the quantity of measurements collected.
It is the ability to turn those measurements into better infrastructure decisions.
A modern road management strategy can combine:
Smartphone Monitoring + IRI + AI Visual Inspection + GIS + Historical Data + Engineering Validation
Each component serves a different purpose.
Smartphone-based monitoring provides scalable network screening.
AI helps process visual information.
GIS provides geographic context.
Historical datasets reveal deterioration trends.
Traditional engineering profilers provide detailed measurements where required.
Together, these technologies create a complementary ecosystem for modern pavement management.
Why RoadBounce Fits the Modern Road Management Workflow
RoadBounce is built around the need for scalable, recurring road condition intelligence.
For road agencies, consultants, contractors, and infrastructure owners, the platform can help transform routine road journeys into structured condition data.
Instead of waiting for infrequent large-scale surveys to understand what is happening across a network, organizations can establish recurring monitoring programs that help identify changing conditions.
RoadBounce can support:
- Network-wide road screening
- Smartphone-based road surveys
- Ride-quality monitoring
- IRI measurements
- AI-powered visual inspections
- GIS-based road condition mapping
- Recurring condition assessments
- Maintenance prioritization
- Infrastructure analytics
- Identification of locations requiring detailed investigation
The result is a more scalable approach to understanding road networks.
Importantly, RoadBounce complements rather than replaces traditional engineering survey technologies. Traditional profilers remain valuable for detailed engineering investigations, while smartphone-based monitoring solutions provide cost-effective network-wide screening and continuous monitoring.
That distinction allows infrastructure managers to use each technology where it delivers the greatest practical value.
Conclusion
Road data analytics is becoming an essential component of modern infrastructure management.
As road networks grow and maintenance budgets face increasing pressure, agencies need better ways to understand network condition, identify deterioration, prioritize interventions, and allocate engineering resources.
A modern road analytics strategy combines condition measurements, IRI, AI-powered visual inspection, GIS, historical data, and recurring monitoring to create a continuously improving picture of infrastructure condition.
Smartphone-based platforms such as RoadBounce can play an important role in this ecosystem by making network-scale road screening and recurring monitoring more accessible.
The objective is not to replace specialized engineering profilers. Instead, it is to establish a smarter workflow:
Screen the network → Identify priorities → Validate critical locations → Plan maintenance → Monitor continuously.
For organizations responsible for large road networks, this approach can turn road surveys from occasional data-collection exercises into an ongoing infrastructure intelligence program.
Frequently Asked Questions
What is road data analytics?
Road data analytics is the process of collecting and analyzing road condition, pavement distress, location, imagery, and historical infrastructure data to support maintenance, planning, and asset management decisions.
Why is road data analytics important?
It helps infrastructure managers understand road conditions across large networks, identify deterioration trends, prioritize maintenance, and determine where detailed engineering investigations may be needed.
Can smartphones be used for road condition monitoring?
Yes. Smartphones can provide sensor and imagery data that support scalable road condition screening and recurring monitoring. Their role should be understood within the appropriate network-monitoring and engineering workflow.
Does RoadBounce replace traditional road profilers?
No. RoadBounce is designed for network-wide screening and recurring road condition monitoring. Traditional profilers remain valuable for detailed engineering investigations and validation.
What is the difference between road screening and engineering validation?
Road screening focuses on efficiently assessing larger networks and identifying priority locations. Engineering validation involves detailed measurements and investigations using specialized engineering equipment where required.
How does GIS improve road data analytics?
GIS connects road condition information to geographic locations, allowing agencies to visualize problems, identify spatial patterns, compare road segments, and prioritize maintenance geographically.
How can road analytics support preventive maintenance?
Recurring condition monitoring can reveal early deterioration and changing road conditions. This gives agencies an opportunity to investigate and potentially intervene before problems become more severe.
What data is useful for pavement management?
Useful datasets include IRI, ride-quality measurements, pavement distress, imagery, GPS coordinates, GIS information, traffic data, maintenance history, road inventory, and specialized engineering survey data.


Leave a Reply