
Potholes are among the most visible signs of pavement deterioration, but their significance extends far beyond individual defects. When potholes are measured systematically across an entire road network, they can reveal patterns of deterioration, maintenance needs, drainage problems, traffic-related damage, and emerging pavement failures.
This is where pothole density becomes a valuable road condition indicator.
Rather than simply counting potholes, transportation agencies can analyze how frequently potholes occur over a defined road distance or area. Combined with other pavement condition data, pothole density can help transform isolated observations into actionable road network intelligence.
For road agencies, consultants, contractors, and infrastructure owners, this supports a more proactive approach to maintenance: identify deteriorating locations, understand their distribution, prioritize interventions, and determine where more detailed engineering investigation may be appropriate.
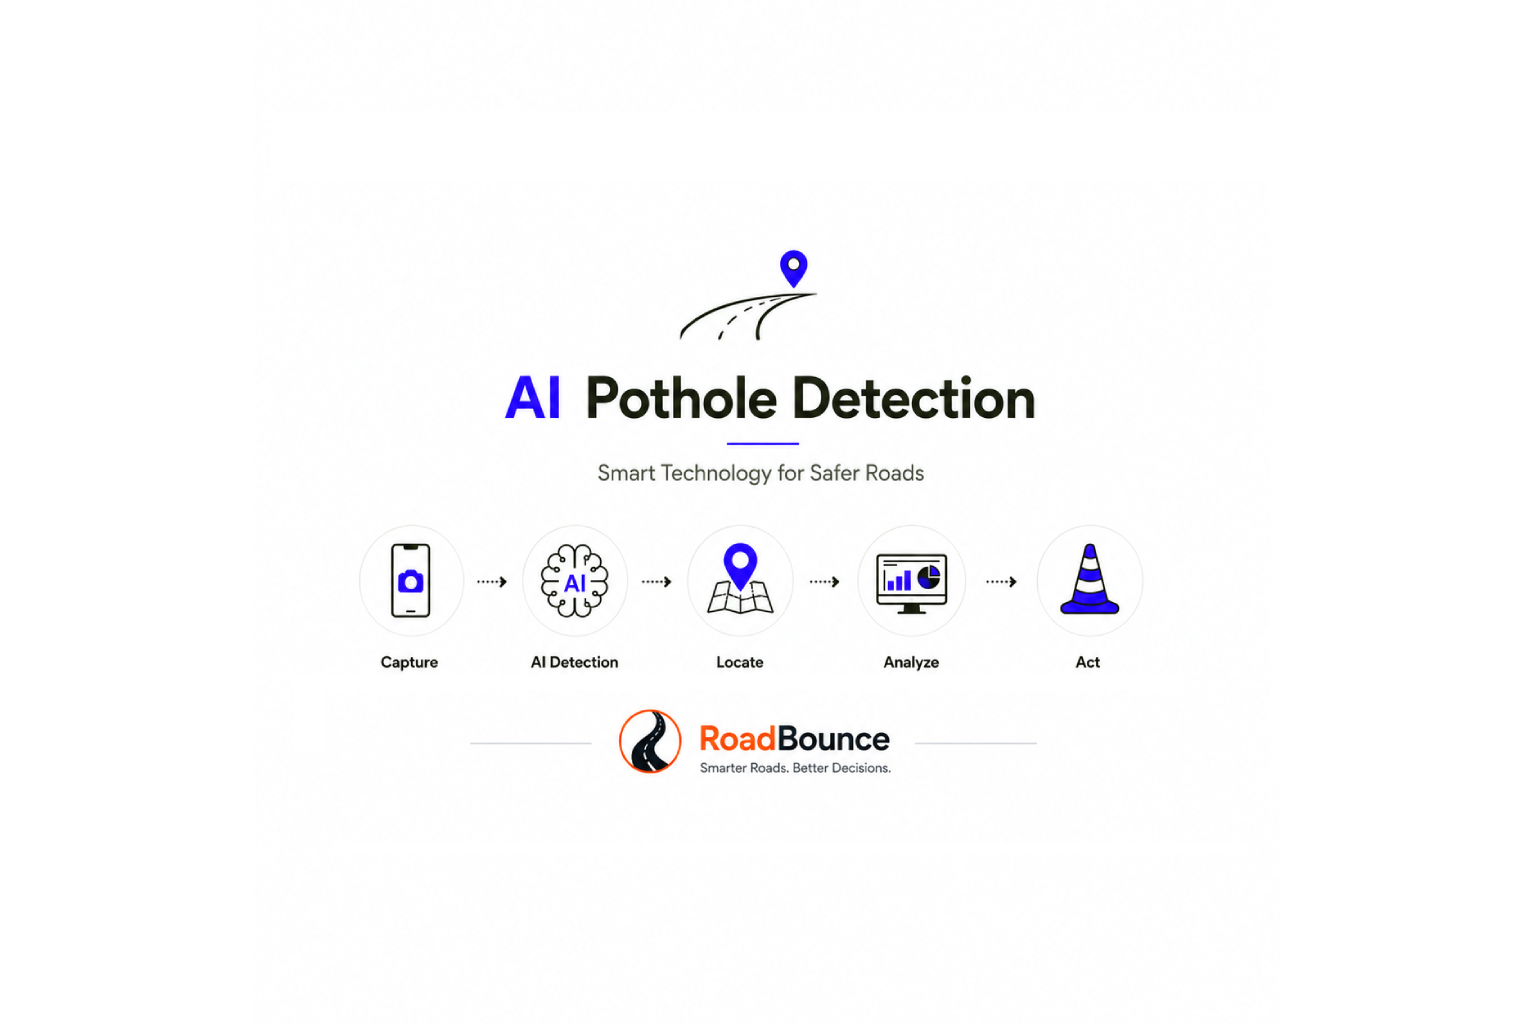
With smartphone-based road monitoring platforms such as RoadBounce, pothole observations can be collected at network scale and combined with location data, ride-quality measurements, visual inspections, and recurring surveys.
What Is Pothole Density?
Pothole density describes the concentration of potholes within a defined section of roadway.
A simple way to express pothole density is:
Pothole Density = Number of Potholes ÷ Surveyed Road Length
For example, if a survey identifies 25 potholes across a 10-kilometre road segment:
25 ÷ 10 = 2.5 potholes per kilometre
However, the appropriate calculation can vary depending on the purpose of the survey and the road characteristics being evaluated.
Agencies may also consider:
- Pothole size
- Pothole severity
- Lane or carriageway
- Road classification
- Traffic volume
- Location
- Pavement type
- Road age
- Previous maintenance activity
- Seasonal conditions
- Drainage characteristics
Consequently, pothole density should generally be treated as one component of a broader pavement condition assessment, rather than a standalone measure of pavement performance.
Why Does Pothole Density Matter?
A single pothole does not necessarily indicate that an entire road is in poor condition.
However, a high concentration of potholes across a road segment can provide an important signal that pavement deterioration may be occurring at a larger scale.
Increasing pothole density may indicate:
1. Accelerating Pavement Deterioration
Potholes often develop when pavement weaknesses combine with water infiltration, traffic loading, freeze-thaw cycles, inadequate drainage, or progressive material failure.
An increasing concentration of potholes can therefore indicate that a pavement section is moving into a more deteriorated condition.
2. Localized Maintenance Problems
High pothole density concentrated in a specific area can help maintenance teams identify locations requiring investigation or intervention.
Rather than treating every road segment equally, agencies can focus resources on areas exhibiting stronger deterioration signals.
3. Recurring Failure
If potholes repeatedly appear in the same locations after repairs, the underlying issue may extend beyond the visible surface defect.
Possible contributing factors can include:
- Drainage deficiencies
- Weak pavement layers
- Subgrade problems
- Utility-related excavation
- Poor previous repairs
- Heavy or unusual loading
- Water infiltration
Recurring monitoring makes it easier to identify these patterns.
Pothole Density as a Network-Level Indicator
One of the biggest advantages of measuring potholes systematically is the ability to move from individual defect management to network-level pavement management.
Traditional inspection processes can provide valuable information about specific roads, but collecting frequent data across a large network can be resource-intensive.
A smartphone-based road survey approach enables road agencies to gather condition information across much larger portions of their networks.
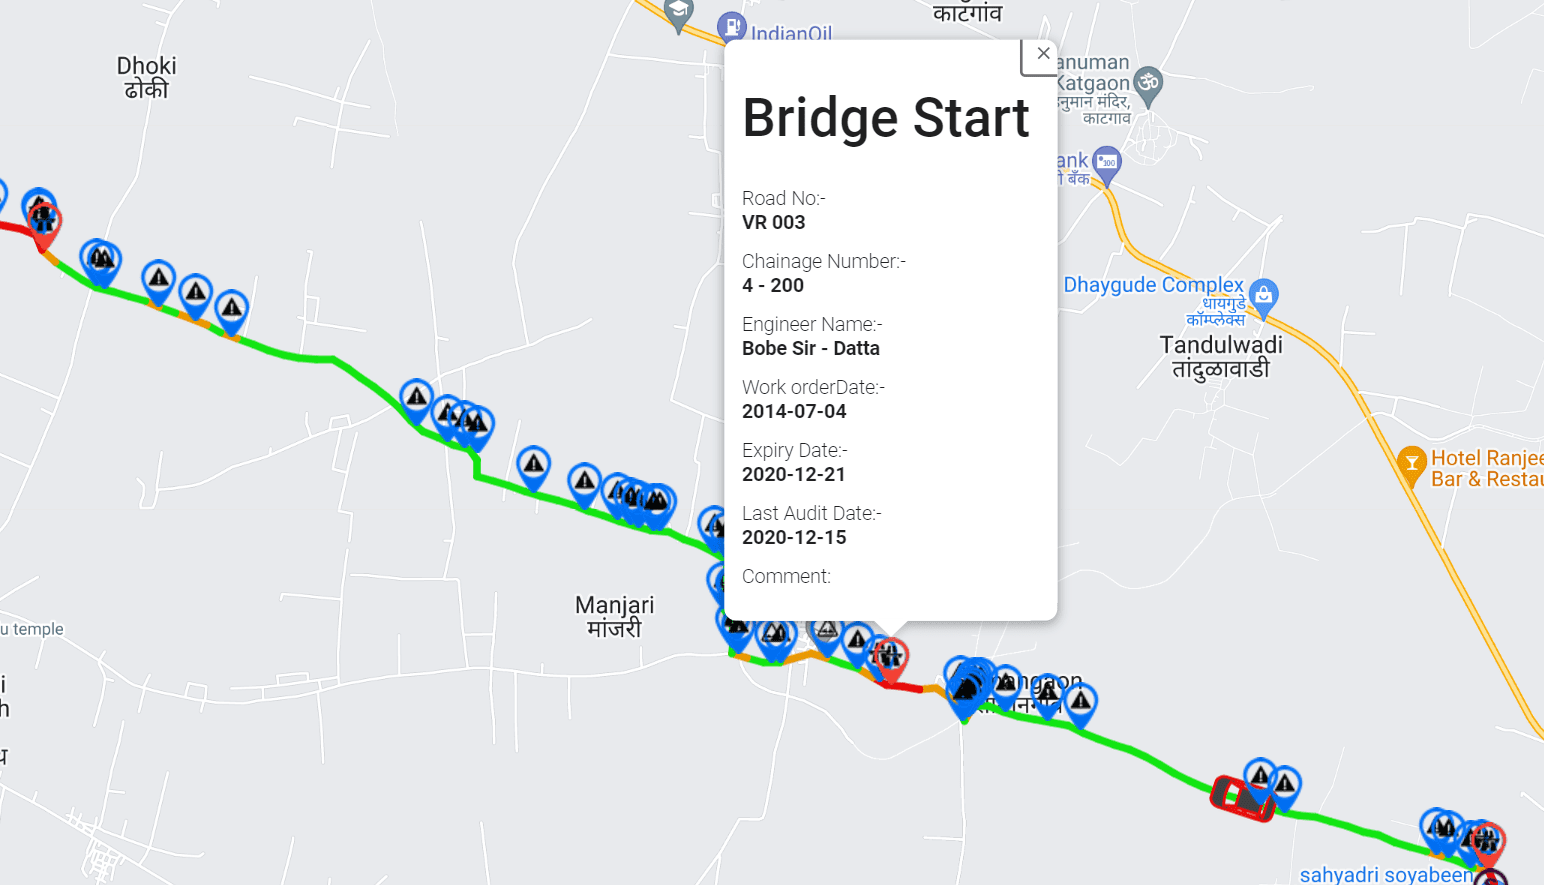
This allows pothole density to be examined geographically.
For example, a GIS-based dashboard could identify:
- Roads with high pothole concentrations
- Areas experiencing rapidly increasing defect levels
- Geographic deterioration hotspots
- Roads requiring additional inspection
- Locations with recurring maintenance problems
- Segments requiring preventive maintenance
- Areas where engineering investigations may be warranted
The result is a more comprehensive view of network condition.
From Pothole Counts to Road Network Intelligence
Counting potholes is useful.
Understanding where, when, and how frequently they occur is considerably more valuable.
Road condition monitoring becomes more powerful when pothole observations are connected with other datasets.
For example:
Pothole Detection + GPS + IRI + AI Visual Inspection + GIS + Historical Surveys
can provide a richer picture of pavement performance.
A road agency could compare current pothole density with previous survey results and identify whether a segment is:
- Stable
- Improving after maintenance
- Gradually deteriorating
- Experiencing rapid deterioration
- Developing recurring defects
This transforms individual observations into a road network monitoring system.
Pothole Density and Preventive Maintenance
One of the most important applications of pothole density data is maintenance planning.
Road maintenance is often more effective when agencies can identify deterioration before extensive pavement failure occurs.
If monitoring identifies increasing defects on a particular road segment, maintenance teams can investigate the location before deterioration becomes more extensive.
This supports a shift from:
Reactive Maintenance → Preventive Maintenance
Instead of waiting until roads require major rehabilitation, agencies can use condition trends to identify where intervention may be appropriate.
Importantly, pothole density alone should not determine the maintenance treatment.
It can serve as a screening and prioritization indicator, while engineering teams consider pavement structure, materials, drainage, traffic loading, environmental conditions, and other relevant factors before selecting an appropriate treatment.
How RoadBounce Supports Pothole Monitoring
RoadBounce is designed to support network-wide road condition monitoring using smartphones and scalable data collection.
Its role is not to replace engineering-grade road profilers. Instead, RoadBounce provides an additional layer of network intelligence that can help agencies understand road conditions across larger geographic areas and identify locations requiring closer attention.
Using smartphone-based surveys, organizations can collect road condition information while travelling through their networks.
This can support:
Network-Wide Screening
Instead of focusing exclusively on selected road sections, agencies can monitor larger portions of their road network and identify potential deterioration hotspots.
Recurring Monitoring
Repeated surveys can help organizations understand how road conditions change over time.
This is particularly useful for identifying deterioration trends rather than relying exclusively on occasional inspections.
Smartphone-Based Road Surveys
Smartphone technology makes it possible to collect road condition information without deploying specialized survey vehicles for every network screening exercise.
AI-Powered Visual Inspection
AI-assisted visual analysis can help identify pavement defects and create structured condition information from road imagery.
GIS-Based Mapping
Condition observations can be geographically mapped, allowing maintenance teams to visualize deterioration patterns and connect them with road assets.
Maintenance Prioritization
Condition data can support the identification of road segments that warrant further investigation, maintenance planning, or more detailed engineering assessment.
Pothole Density and IRI: Why Both Matter
Potholes and ride quality provide different perspectives on road condition.
IRI (International Roughness Index) is commonly used to characterize longitudinal road roughness and ride quality. Pothole information, meanwhile, focuses on visible localized pavement defects.
A road may therefore have:
- Low pothole density but poor overall ride quality
- High pothole density but relatively limited longitudinal roughness
- Both high roughness and high pothole density
- Low levels of both indicators
Looking at multiple indicators provides a more complete understanding of pavement condition.
For this reason, combining IRI measurements with AI visual inspections and GIS-based defect mapping can provide stronger network-level intelligence than relying on a single metric.
What High Pothole Density Can Reveal
A high pothole density does not automatically identify the underlying cause of pavement failure.
Instead, it can act as a signal that further investigation may be warranted.
Depending on the context, concentrated pothole occurrence could point toward:
Drainage Issues
Water is a major contributor to many forms of pavement deterioration. Areas with inadequate drainage or water infiltration may experience accelerated damage.
Structural Weakness
Repeated pothole formation can indicate potential weaknesses within pavement layers or the supporting subgrade.
Heavy Traffic Loading
Roads exposed to substantial traffic loading may experience faster deterioration, particularly when pavement condition is already compromised.
Environmental Effects
Temperature variations, moisture, freeze-thaw cycles, and other environmental factors can contribute to pavement distress.
Repair Quality or Recurrence
If potholes repeatedly return following repairs, additional investigation may be required to understand the underlying cause.
These interpretations should be validated against local conditions and engineering evidence rather than inferred from pothole counts alone.
Using Pothole Density to Prioritize Road Maintenance
Road agencies often face a fundamental challenge:
There are more roads requiring attention than available maintenance resources.
Network-level condition data can help create a structured prioritization process.
A simplified workflow could look like this:
1. Survey the Network
Collect road condition information across relevant road segments.
2. Detect and Map Defects
Identify potholes and other visible pavement distress.
3. Calculate Pothole Density
Normalize defect observations by road length or another appropriate measurement.
4. Combine Condition Indicators
Consider pothole density alongside IRI, visual distress, road classification, traffic, and historical condition data.
5. Identify Deterioration Hotspots
Use GIS to locate areas exhibiting significant or increasing distress.
6. Prioritize Further Assessment
Direct inspection teams and specialized survey resources toward locations requiring additional investigation.
7. Select Maintenance Strategies
Engineering teams evaluate the underlying causes and determine appropriate treatments.
This creates a more targeted approach to infrastructure management.
RoadBounce and Traditional Road Profilers: Complementary Roles
Road monitoring technologies should be selected according to the question being answered.
RoadBounce is designed for network screening and recurring road condition monitoring.
Traditional engineering-grade profilers remain valuable when detailed measurements are required for engineering investigations, project-level analysis, or other specialized applications.
The two approaches can therefore work together.
Network Screening
RoadBounce
- Broad network coverage
- Frequent monitoring
- Smartphone-based surveys
- Pothole and visual distress observations
- IRI and ride-quality information
- GIS-based mapping
- Deterioration trend monitoring
- Maintenance prioritization
↓
Engineering Validation
Traditional Profilers and Specialized Surveys
- Detailed engineering measurements
- Project-level investigations
- Specialized pavement analysis
- Engineering validation
- Detailed assessment of priority locations
This approach allows agencies to use network-level monitoring to determine where specialized engineering resources should be deployed.
Rather than surveying every road with specialized equipment at the same frequency, organizations can use network screening to identify locations where deeper investigation is justified.
Why Continuous Monitoring Matters
Road condition is not static.
A road classified as acceptable today may develop significant deterioration over the following months due to traffic, weather, drainage problems, construction activity, or other factors.
Periodic monitoring can reveal these changes.
For example, consider a road segment with the following hypothetical trend:
| Survey | Potholes/km |
|---|---|
| January | 0.8 |
| April | 1.2 |
| July | 2.0 |
| October | 3.1 |
The individual values provide useful information, but the trend is arguably more important.
The increase suggests that the segment deserves attention and potentially further investigation.
Recurring road surveys can therefore help agencies move from a static condition snapshot toward continuous infrastructure intelligence.
Beyond Potholes: Building a Complete Road Condition Picture
Pothole density is only one part of network-level pavement monitoring.
A modern road asset management strategy can combine multiple information sources, including:
- Pothole locations
- Pavement cracking
- Surface defects
- Rutting indicators
- Ride quality
- IRI measurements
- Road imagery
- AI-based visual inspections
- GPS coordinates
- Road classifications
- Historical maintenance records
- Survey history
- GIS asset information
Combining these datasets makes it possible to understand not simply where defects exist, but how road conditions are changing across an entire network.
This is particularly valuable for organizations managing thousands of kilometres of roadway.
Turning Pothole Data Into Actionable Infrastructure Intelligence
The real value of pothole density is not the number itself.
It is what the number enables an organization to do.
A road agency can use pothole density data to ask:
- Where are pavement defects concentrated?
- Which road sections are deteriorating?
- Which locations are experiencing recurring problems?
- Where should maintenance teams focus?
- Which roads require closer inspection?
- Where should specialized engineering surveys be deployed?
- Are deterioration patterns changing over time?
- Are maintenance interventions improving road condition?
These questions move road management beyond simple defect reporting toward data-driven infrastructure decision-making.
Conclusion
Pothole density provides a practical way to quantify the concentration of visible pavement defects across a road network. When tracked over time and combined with other road condition indicators, it can help reveal deterioration patterns, identify hotspots, support maintenance prioritization, and guide further engineering investigation.
For large road networks, the ability to collect this information frequently and at scale is increasingly important.
RoadBounce provides a smartphone-based approach to network-wide road screening and continuous road condition monitoring, helping road agencies and infrastructure organizations gather actionable information across their networks.
The objective is not to replace specialized engineering profilers. Instead, RoadBounce can complement traditional profiling programs by helping organizations identify where attention is needed most, optimize the deployment of specialized survey resources, and build a more continuous understanding of network condition.
Ultimately, effective pavement management depends on knowing what is happening across the network, where it is happening, and how conditions are changing over time.
Pothole density is one important piece of that picture. Combined with recurring monitoring, IRI measurements, AI-powered visual inspection, GIS mapping, and engineering validation, it can become part of a broader road network intelligence strategy designed to support smarter, more proactive infrastructure management.

Leave a Reply